CRYPTOUSDUA
🚀 The total capitalization of the crypto market has broken through the historical maximum of $4.1T 💰📈 — a new round of the bull cycle! 📊 Institutional demand, the growth of DeFi and NFT platforms are strengthening the trend 🌐🔥. However, with overheated indicators, corrections are possible ⚠️, which will give a chance for profitable entries.
DEFI1.36%
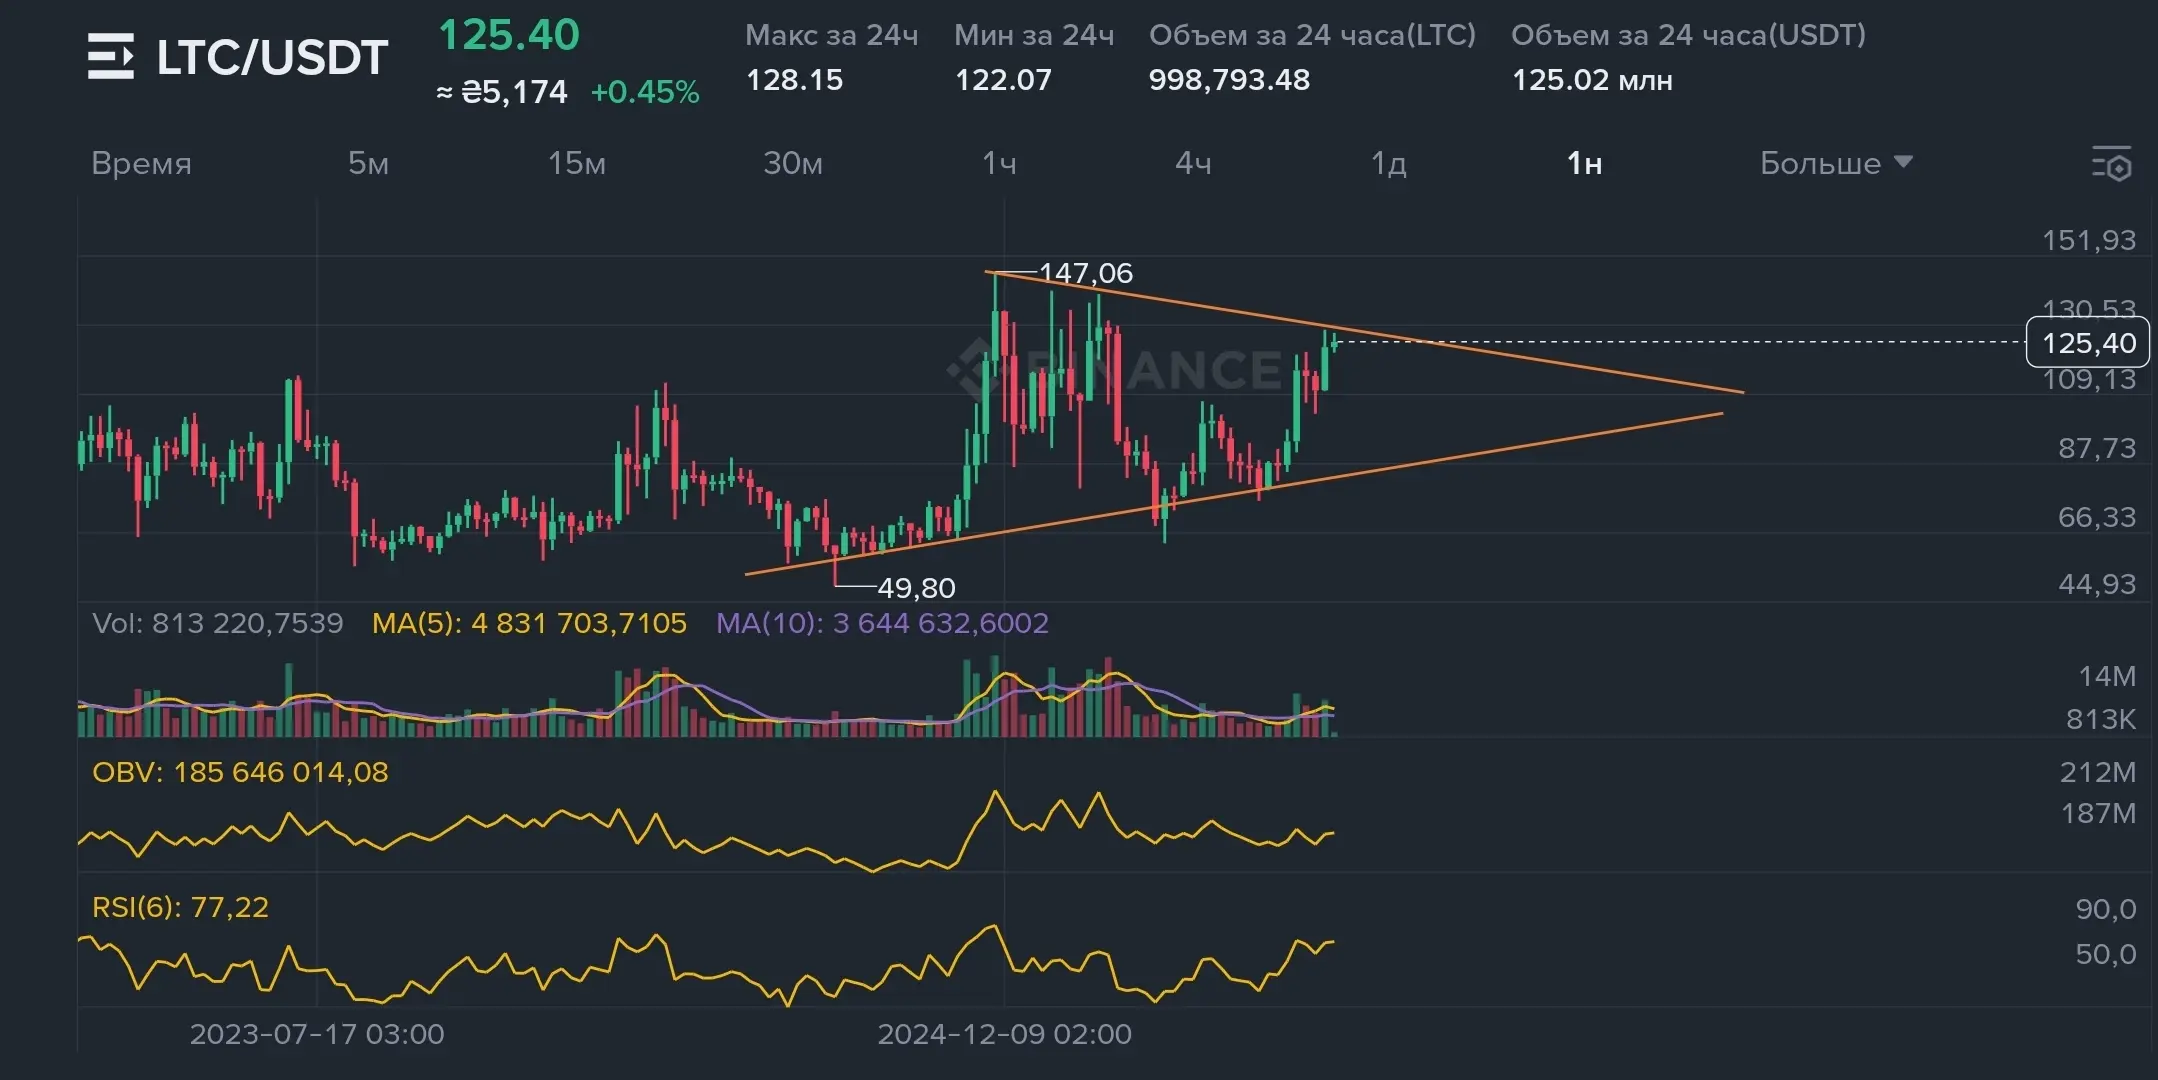
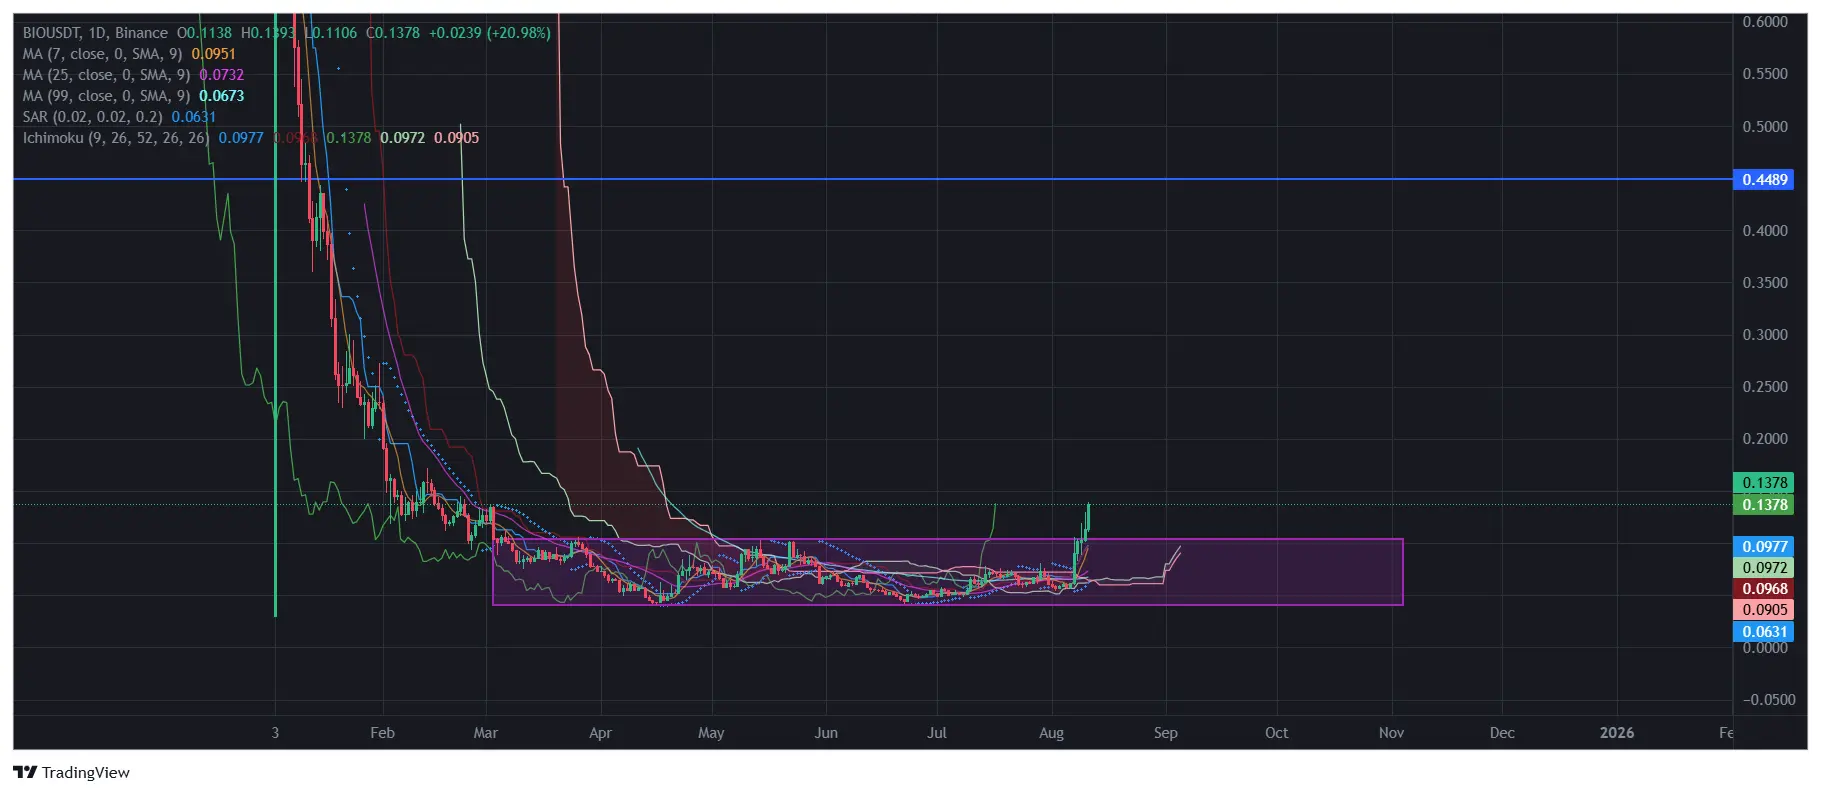
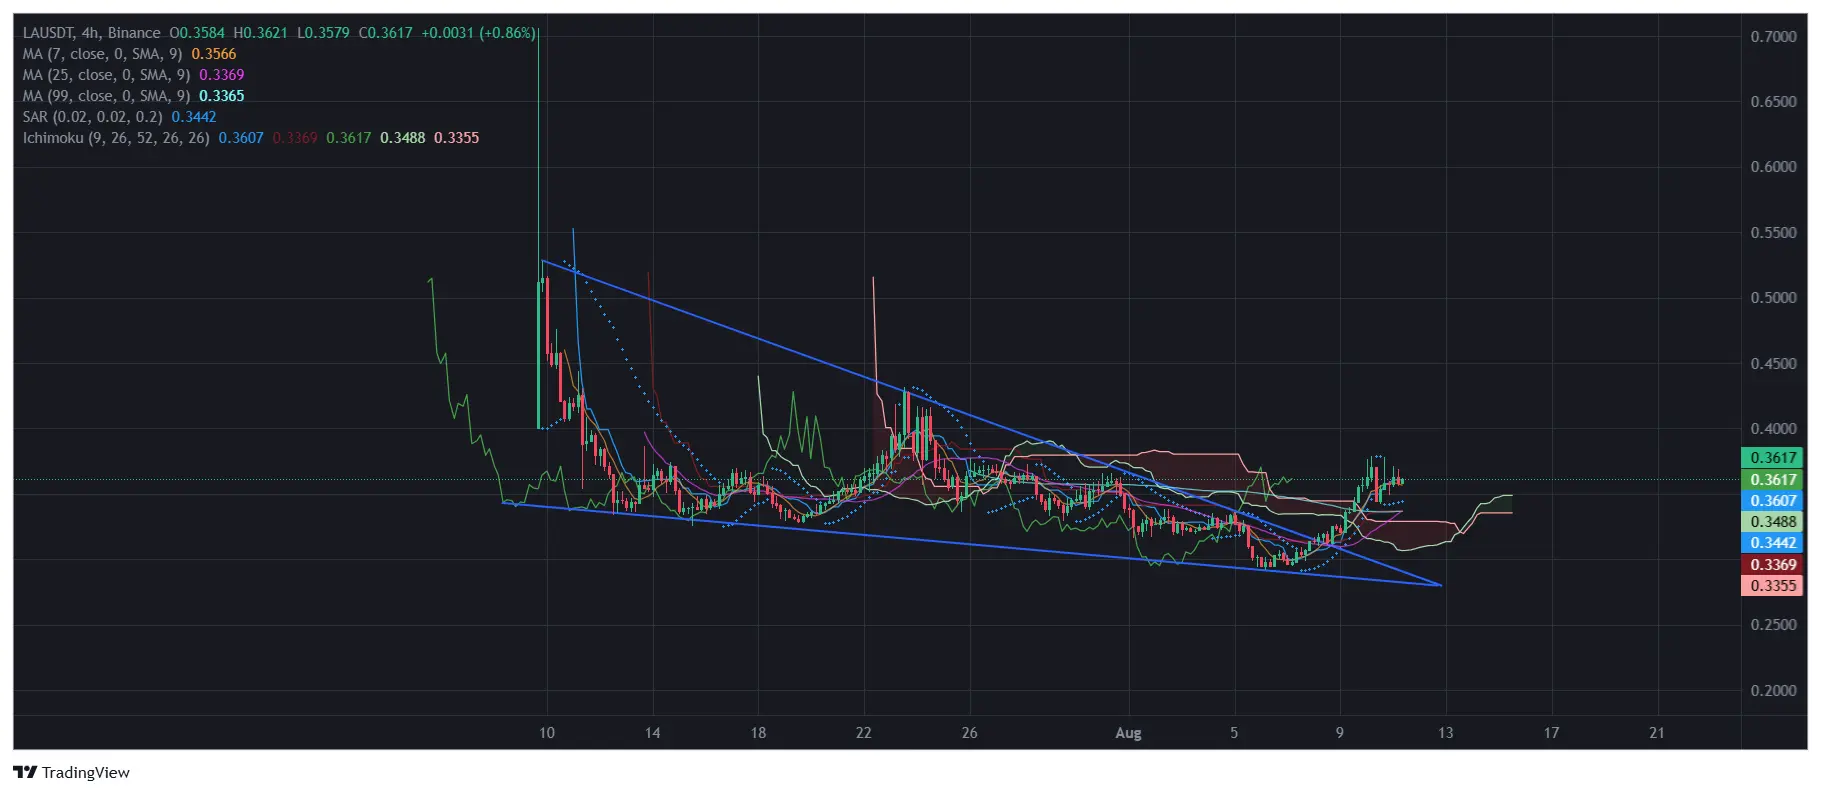
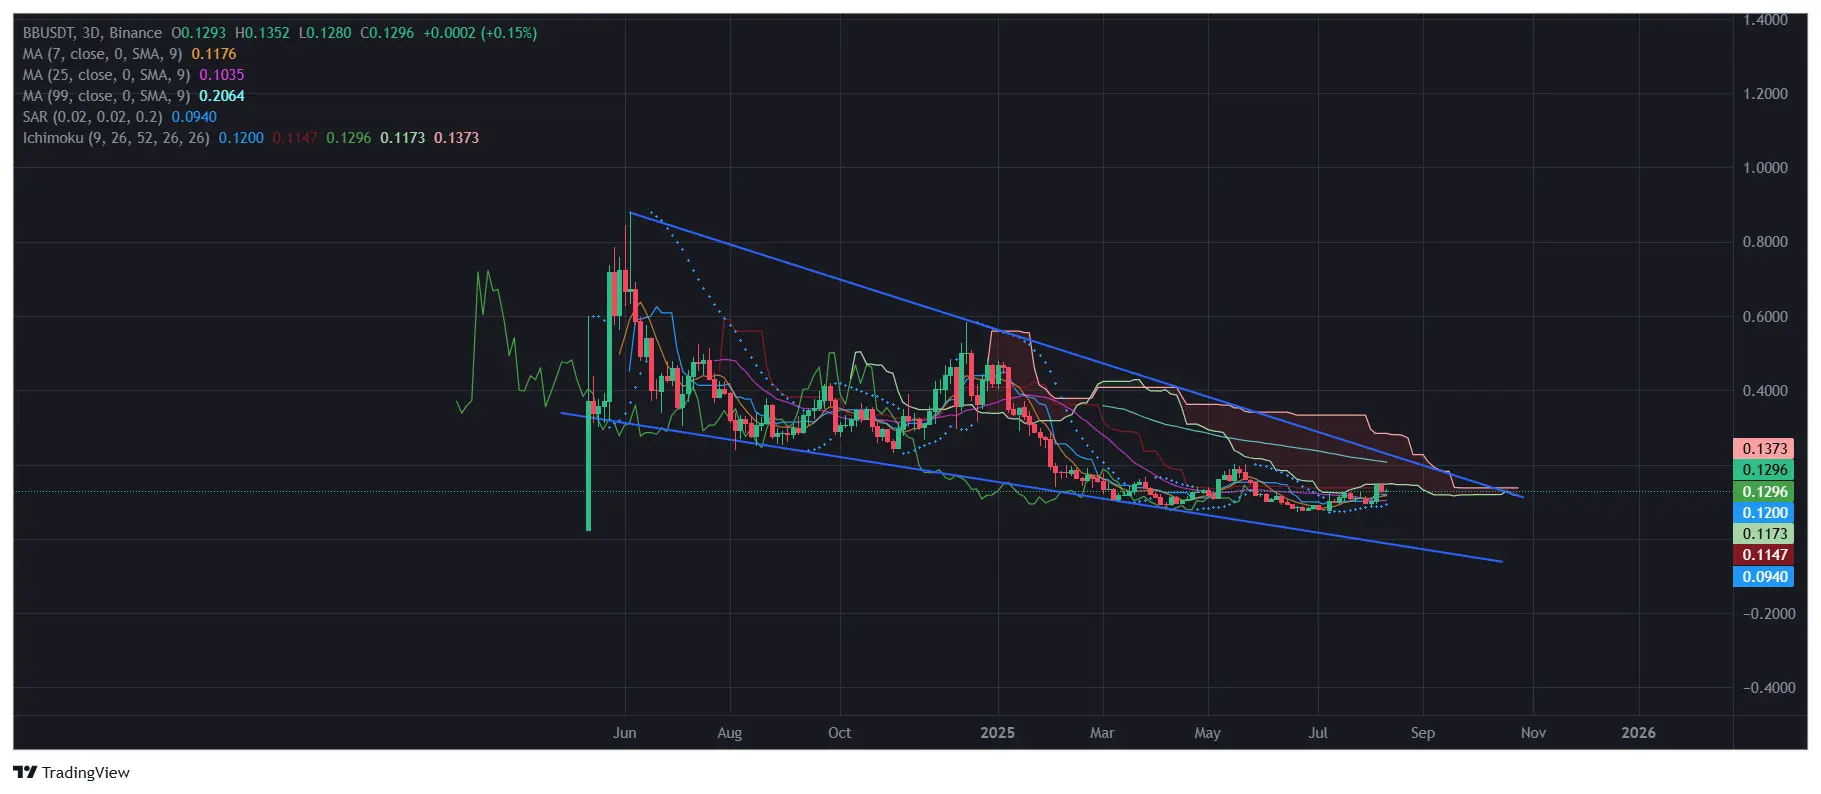
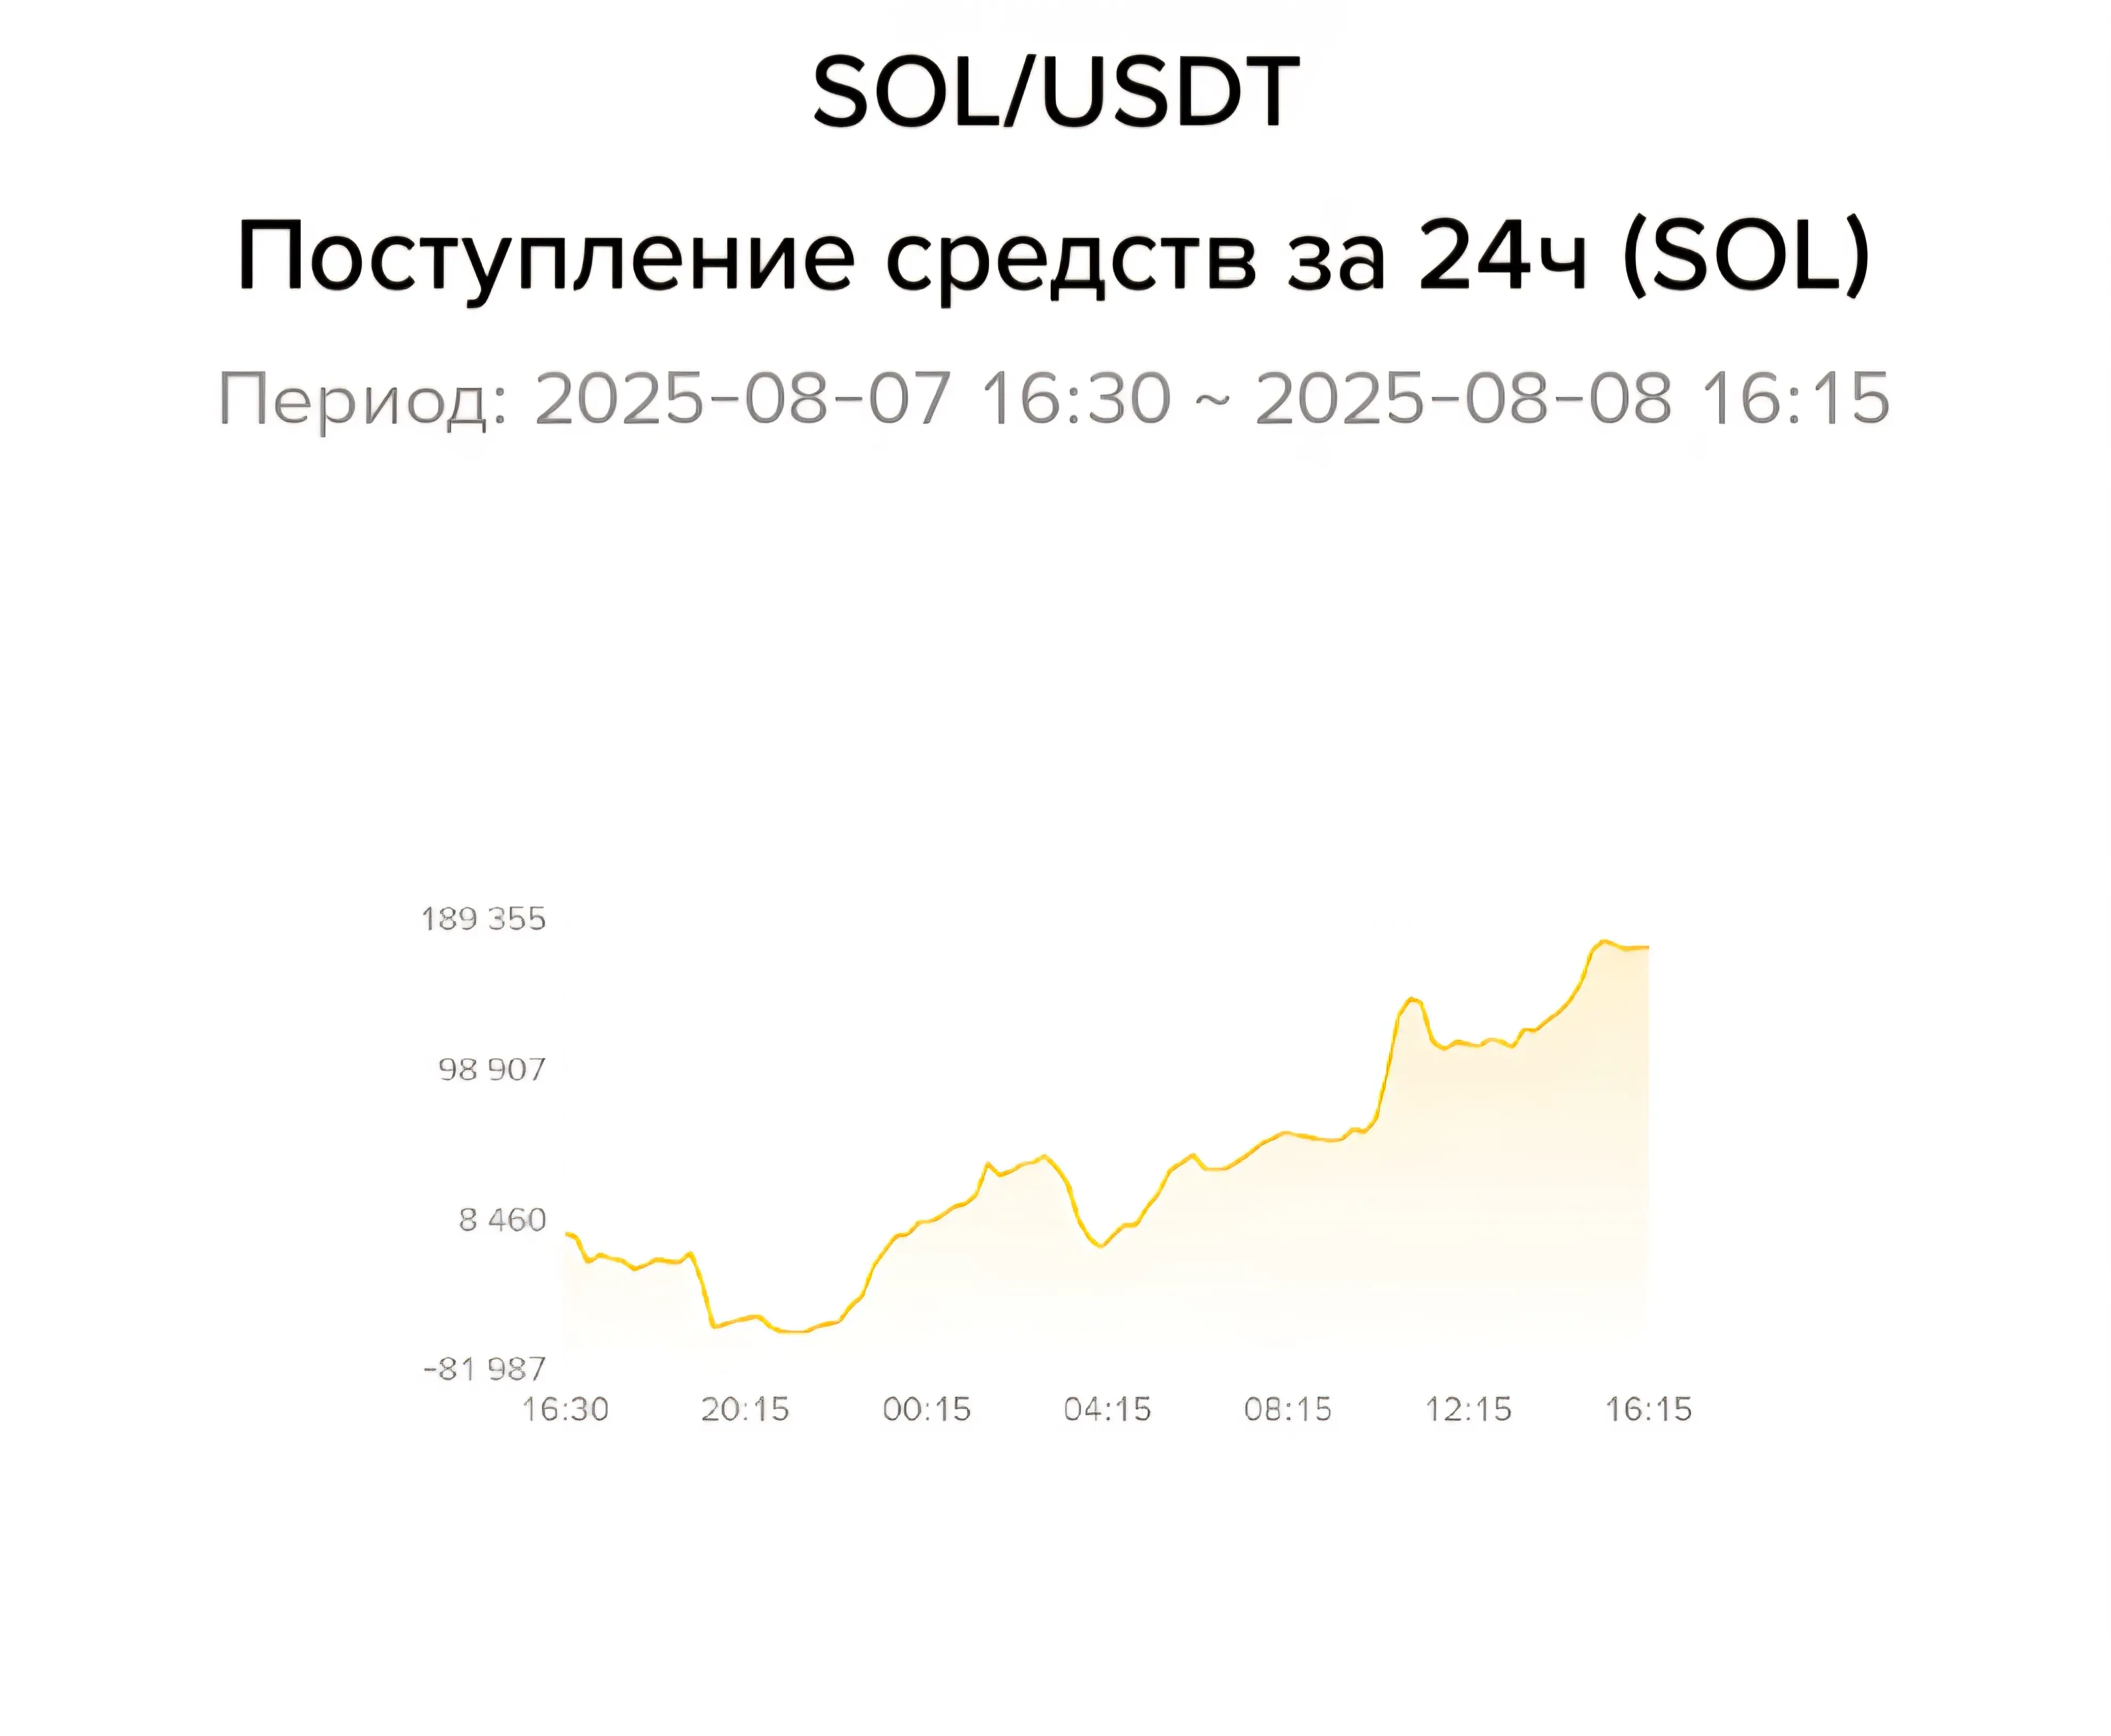
[The user has shared his/her trading data. Go to the App to view more.]