- Topic1/3
17k Popularity
25k Popularity
20k Popularity
53k Popularity
20k Popularity
- Pin
- 📢 Gate Square #Creator Campaign Phase 2# is officially live!
Join the ZKWASM event series, share your insights, and win a share of 4,000 $ZKWASM!
As a pioneer in zk-based public chains, ZKWASM is now being prominently promoted on the Gate platform!
Three major campaigns are launching simultaneously: Launchpool subscription, CandyDrop airdrop, and Alpha exclusive trading — don’t miss out!
🎨 Campaign 1: Post on Gate Square and win content rewards
📅 Time: July 25, 22:00 – July 29, 22:00 (UTC+8)
📌 How to participate:
Post original content (at least 100 words) on Gate Square related to
- 📢 Gate Square #MBG Posting Challenge# is Live— Post for MBG Rewards!
Want a share of 1,000 MBG? Get involved now—show your insights and real participation to become an MBG promoter!
💰 20 top posts will each win 50 MBG!
How to Participate:
1️⃣ Research the MBG project
Share your in-depth views on MBG’s fundamentals, community governance, development goals, and tokenomics, etc.
2️⃣ Join and share your real experience
Take part in MBG activities (CandyDrop, Launchpool, or spot trading), and post your screenshots, earnings, or step-by-step tutorials. Content can include profits, beginner-friendl
- 🎉 Gate Square’s "Spark Program" Surpasses 1,000 KOLs!
💥 The creator ecosystem is in full bloom!
📈 Get featured, earn rewards, and grow your influence—what are you waiting for?
💰 Cash incentives ✔️
🚀 Traffic support ✔️
👑 Exclusive verification ✔️
From 0 to 1,000 in just weeks—Gate Square is becoming the epicenter of Web3 content! ⚡
You’re not just posting content, but the next "viral opportunity"!
🌟 Join the Spark Program and kickstart your breakthrough!
👉 https://www.gate.com/announcements/article/45695
0723 Bitcoin short-term capital game intensifies, retail investor bearish sentiment rises.
0723 Bitcoin/Ethereum market report ❤️ ❤️
The price of Bitcoin has entered a critical decision period under the dual pressure of diverging policy expectations and the convergence of technical factors. In the short term, attention should be paid to the directional breakout of the $116,000 central oscillation and the balance signals of futures long and short positions.
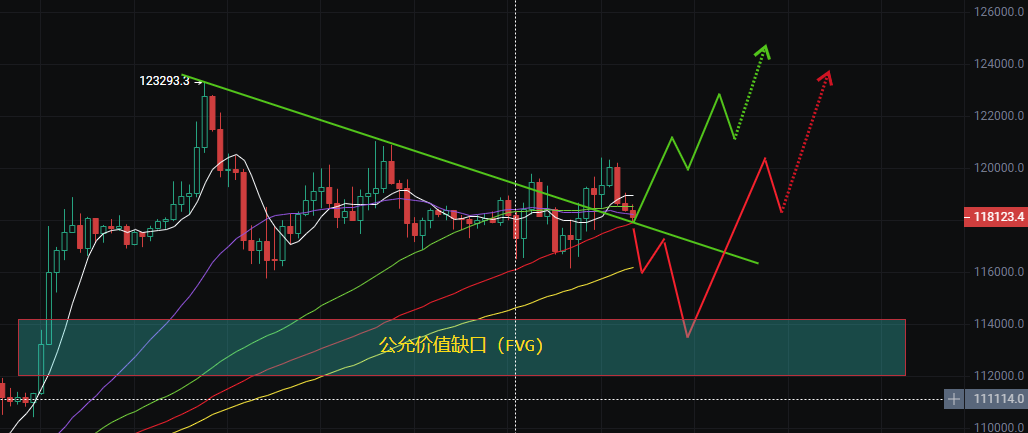
Due to the implementation of tariff policies (effective August 1) and hawkish signals expected from the CPI, the Bitcoin price once dipped to $116,000, but quickly rebounded with the intervention of whale funds, forming a daily candlestick with a long lower shadow, indicating strong support at $116,000. The price stabilized at the $116,000 support level on the daily chart but failed to effectively break through the $120,250 resistance, forming a "doji" pattern. In the short term, caution is needed regarding the shift in bullish and bearish forces. From the intraday trend, the price has formed a wide oscillation between $116,000 and $120,000, but has not yet met the required trading volume level, making it difficult for the price to break upwards. From a technical perspective, Bitcoin has already broken through a triangular formation on the 4-hour chart, which may indicate the beginning of a new bullish phase, with a potential target near $126,000. While a retest of $120,000 is still possible, the potential target (Standard Chartered Bank predicts a target value of $125,000-$130,000 for the third quarter) may first require a pullback to the daily fair value gap between $115,300 and $112,000 (FVG)), to accumulate liquidity for a healthier trend. It can be seen that entering this area may trigger a large-scale net long liquidation, opening up space for the price to break above the high of $123,000. However, in the short term, attention may need to be focused again on whether the price will retest around $115,700, and whether there are signs of a quick rebound. Failure to do so may indicate a weakening of momentum and bring further downside risks. In short, the strength and speed of the rebound from the liquidity zone will determine whether Bitcoin is preparing for further upward movement or deeper adjustments. It is noteworthy that Bitcoin ETF had a net inflow of $12 million, and if the fund inflow does not continue to be sustained, it may hinder the price from moving above $123,000.
✅ ✅ Summary: Technical indicators show weakening bullish momentum, mid-term on-chain data and institutional capital inflows provide strong support for prices, but short-term capital battles are intensifying. In the short term, focus on the strength of the breakout signals in the range of $118,000 to $120,000, as well as the strong upward standard line support at $115,000.
👉 👉 Trading Suggestions: 1. Range Trading Strategy: Bullish - Consider buying in batches in the range of $117,500 - $118,500, with a stop loss at $116,000 and a target of $121,500; Bearish - Consider lightly shorting in the range of $120,000 - $121,000, with a stop loss at $123,000 and a target of $118,000.
Mid-term: Focus on layout opportunities below $115,000, gradually increase holdings on dips, with targets that can refer to institutional forecast values.
The current price of Ethereum is in the fluctuation range of 3618-3770 USD, short-term constrained by the resistance level of 3785, with a key resistance level above at 3800 USD (psychological barrier). If it continues to stabilize above 3700 USD, it may further challenge the test at 3800 USD. If there is a pullback to 3600 USD, it may form a short-term buying opportunity. Conversely, if it unexpectedly breaks below the lower boundary of the channel at 3550 USD and remains under pressure at 3600 USD, it may trigger a technical pullback to 3420 USD. The daily inflow of the spot Ethereum ETF has narrowed to 120 million USD (an 80% decrease from the previous day), and the pace of fund inflow has slowed down, with weakened short-term incremental support, necessitating caution against the possibility of a continued pullback.
✅ ✅ Summary: Pay short-term attention to the breakthrough of the 3785 resistance on Ethereum, especially noting changes in trading volume, while also watching the support strength or cycle in the 3600-3700 USD range. If a double bottom pattern or on-chain accumulation signals (such as whales continuing to increase their positions) forms in this range, one can gradually position for a medium-term rise (1-4 weeks).
👉 👉 Trading Recommendations: 1. Long: If the price remains stable at 3785 with increasing trading volume, consider taking a small long position with a target of 4020 and a stop loss at 3620; 2. Short: If it breaks below 3610 and RSI is below 40, consider shorting at the rebound, with a target of 3420 and a stop loss at 3785.
Mid-term trend: Focus on the support above the key line at 3240, looking for buying opportunities on dips.
Special reminder: This article is for readers' reference only and is not intended as investment advice!!!