Two key charts to watch right now are USDT.D and DXY.
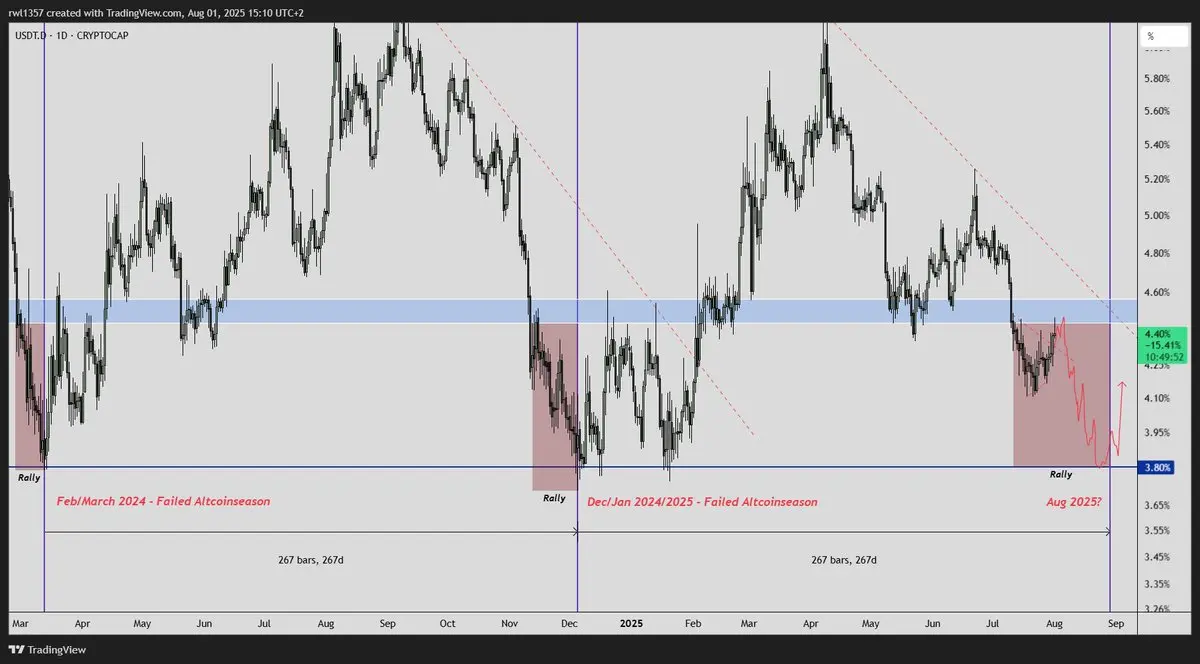
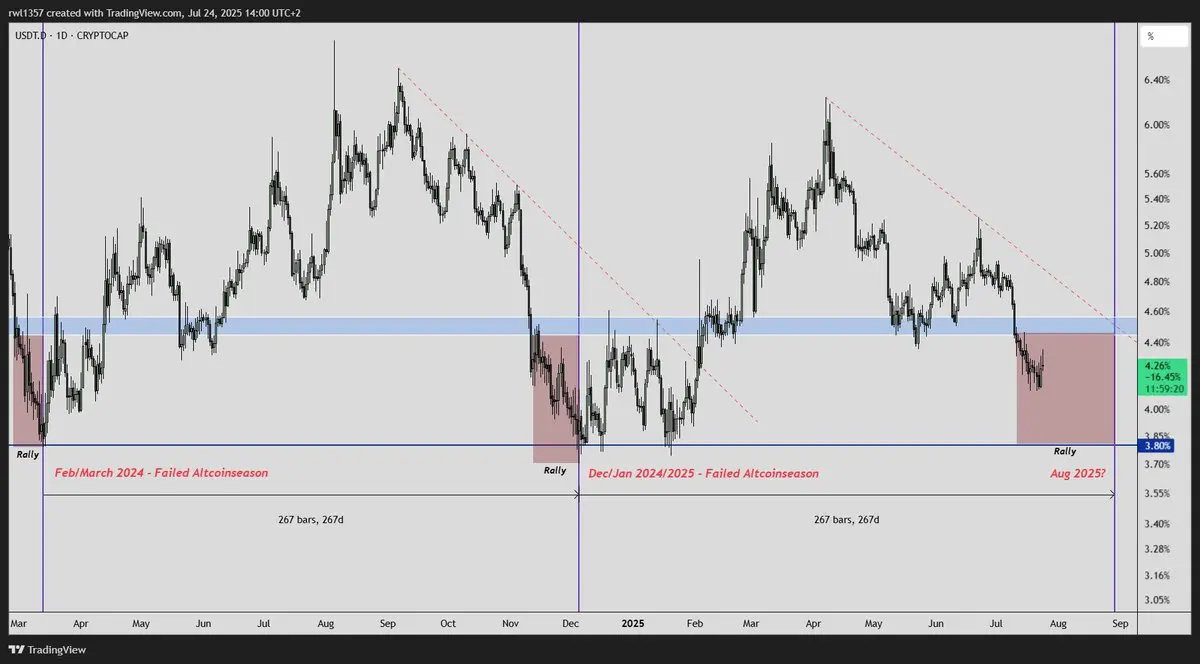
🔹USDT.D is currently sitting right at 4.45%, a critical level as the market appears to be printing a local bottom.
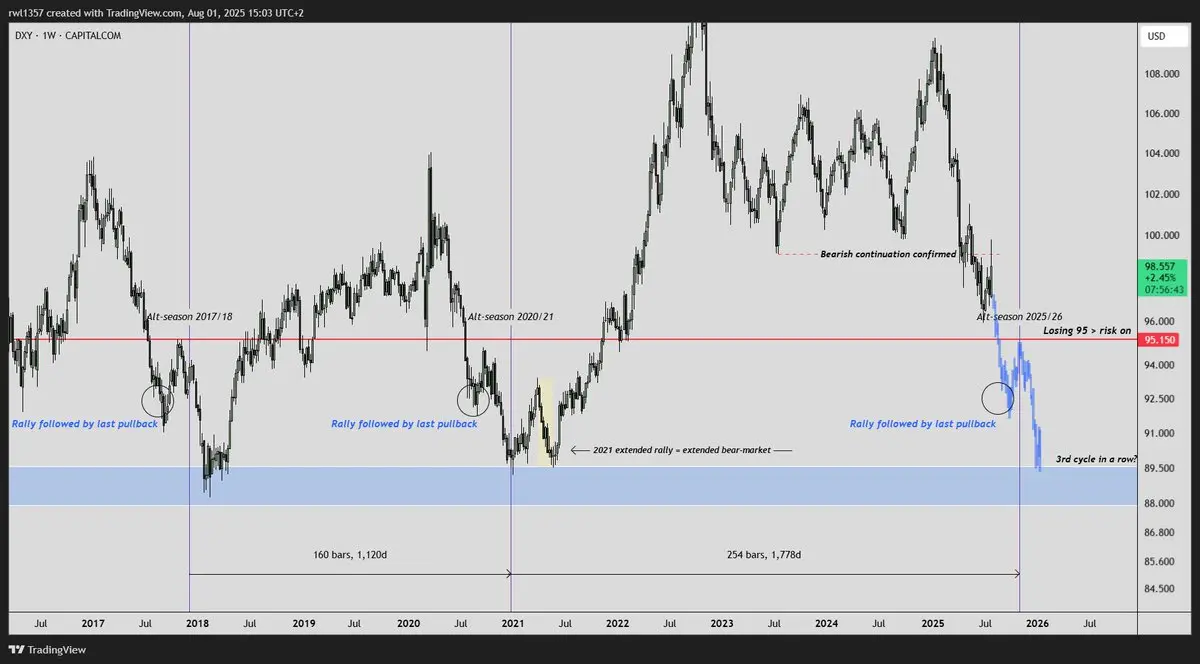
🔹DXY recently rejected and confirmed a breakdown below 100 for the first time, which opens the path to 95 initially, and eventually a drop toward 89–90. Historically, a move to that zone has marked a major bottom and cycle tops just as it did in the past.
That said, we're still far from those levels, meaning market conditions remain favorable for buying, especially in risk assets.
One important thing to keep in mind: there’s